
Crypto Blog
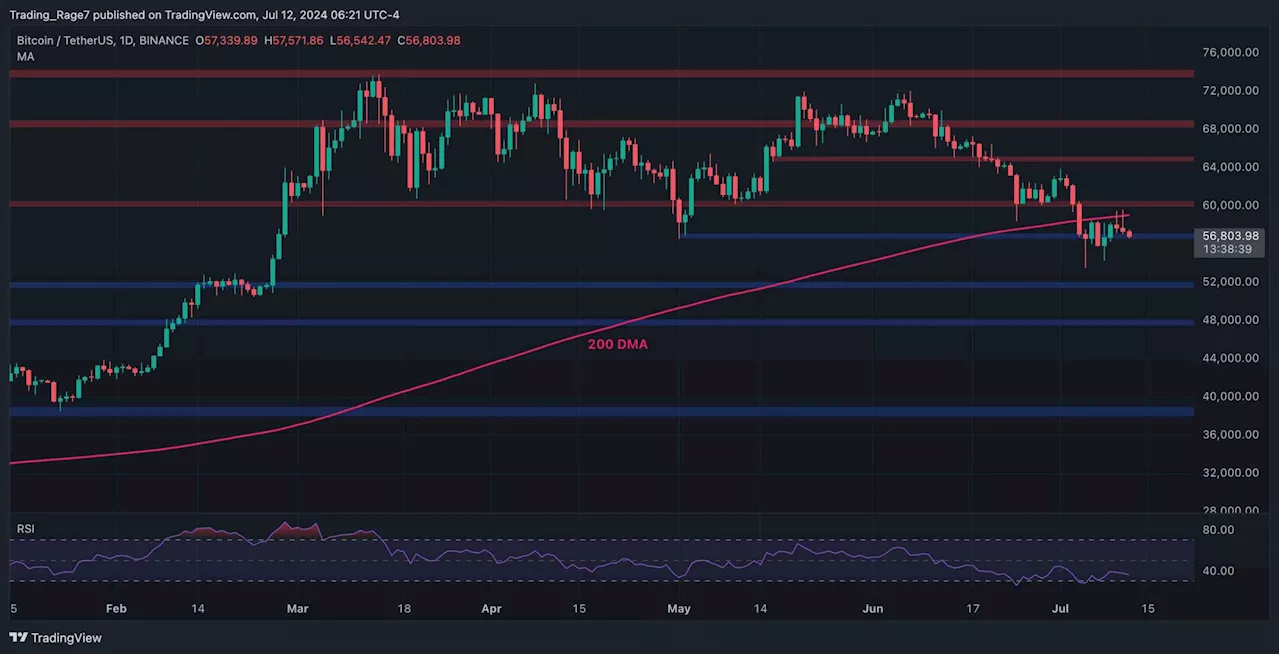
Bitcoin’s price has been consolidating over the past couple of weeks following a recovery from the $56K support level. This behavior has left investors wondering whether a new record high will be witnessed in the short term.
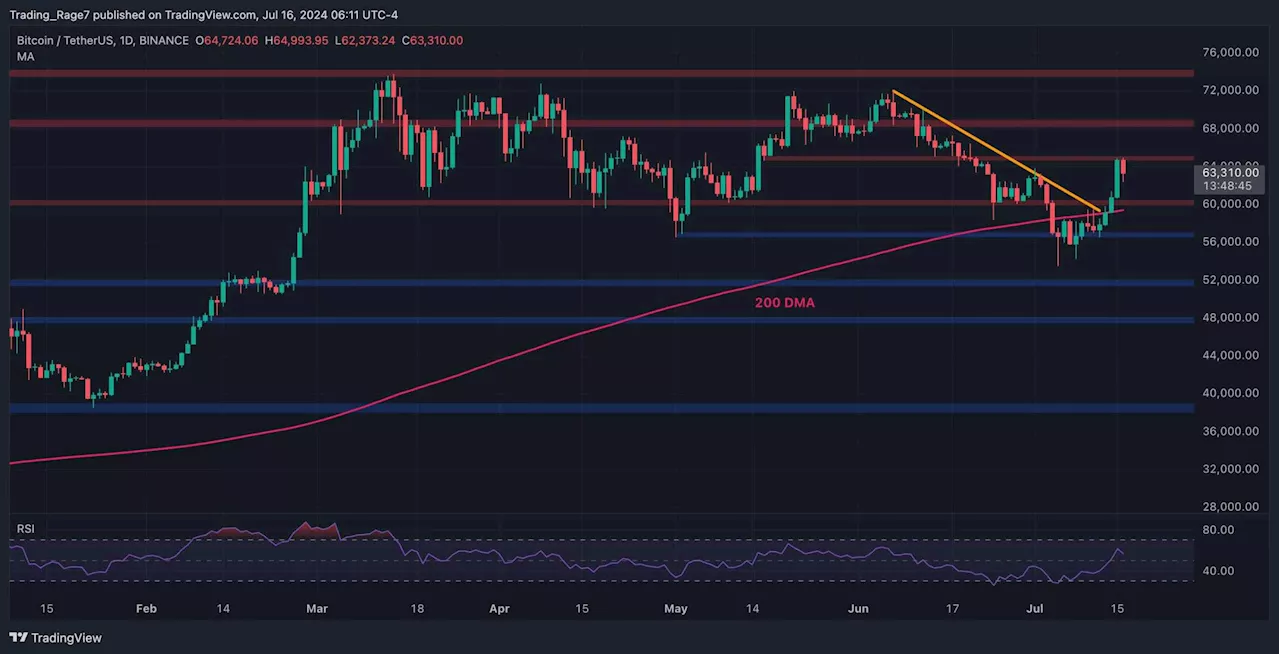
If the support level gets broken, the 200-day moving average, located around $61K, would be the next target for the bears. Still, as long as BTC trades above the 200-day moving average, the trend can be considered bullish.Looking at the 4-hour chart, the price shows a gradual decline in a falling wedge pattern. The cryptocurrency has found support at $64K and the lower boundary of the pattern.
While Bitcoin’s price is failing to continue its upward trend, analyzing the behavior of market participants would be beneficial. This chart presents the Bitcoin Exchange Netflow and its 30-day standard moving average. Positive values indicate deposits and negative values indicate withdrawals from exchanges on aggregate.
United Kingdom Latest News, United Kingdom Headlines
Similar News:You can also read news stories similar to this one that we have collected from other news sources.
Buying the dip? Bitcoin institutional investors add 100K BTC in a weekBitcoin institutional investors go on a 100,000 BTC buying spree amid BTC price lows.
Read more »
 Bitcoin Price Analysis: Likelihood of a BTC Drop to $52K Increasing Following Recent DeclineCrypto Blog
Read more »
 Bitcoin Price Analysis: BTC Bulls Back in Town but Will $60K Fall?Crypto Blog
Read more »
 Bitcoin Price Analysis: Massive Volatility for BTC Around $64K but What’s Next?Crypto Blog
Read more »
 Bitcoin Price Analysis: Here’s What it Will Take for BTC to Break Above $65KCrypto Blog
Read more »
 Bitcoin Price Analysis: Here’s the Next Target for BTC Before Bulls Can Hope for $70KCrypto Blog
Read more »