Crypto Blog
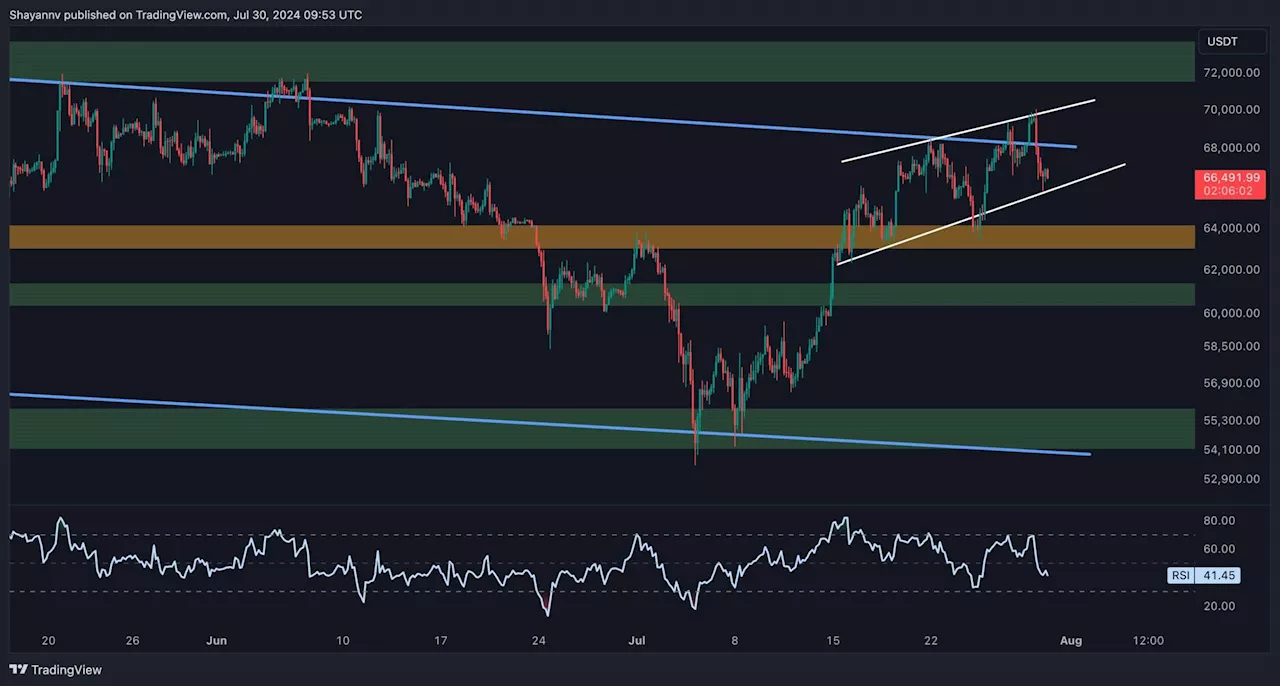
Following an impulsive rally, Bitcoin lost its bullish momentum upon reaching the $70K threshold, indicating the presence of sellers in the market.
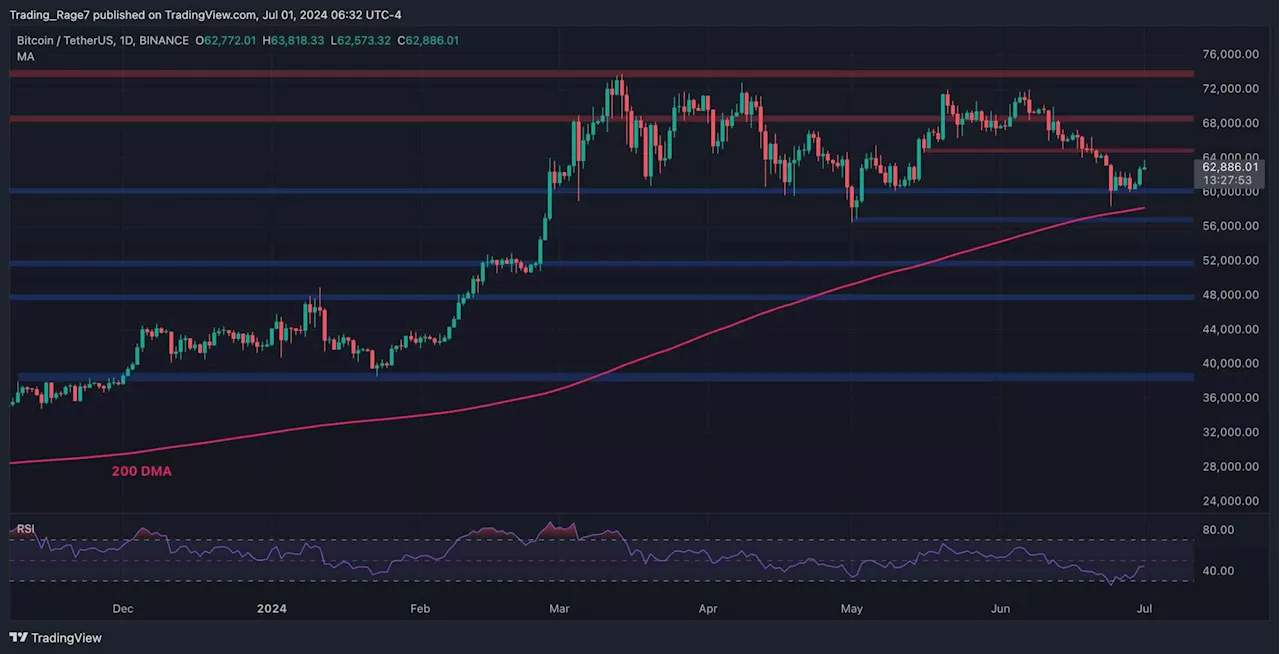
A detailed analysis of Bitcoin’s daily chart reveals that after decisively breaking above the 100-day moving average of $64.4K, the price continued its upward momentum toward the crucial and psychological resistance zone of $70K. If BTC breaks below the 100-day MA in the near future, this will signal a notable bearish trend, possibly leading to a plunge toward the $60K pivot. Overall, Bitcoin is expected to continue its sideways consolidation in the short term, ultimately receiving support and initiating a fresh bullish surge.On the 4-hour chart, following an impulsive surge initiated from the crucial $55K support region, Bitcoin surpassed multiple key resistance levels, including $60K and $65K.
The formation of this pattern, coupled with a bearish divergence between the price and the RSI indicator, indicates a potential bearish reversal in the short term, with the price retracing back toward the $65K crucial support region. This bearish scenario is only valid if BTC first breaks below the ascending wedge’s lower boundary.
United Kingdom Latest News, United Kingdom Headlines
Similar News:You can also read news stories similar to this one that we have collected from other news sources.
 Bitcoin Price Analysis: Is the BTC Correction Over Following Latest Move to $63K?Crypto Blog
Read more »
 Bitcoin Price Analysis: Is the BTC Bull Run Over as Bulls Lose 200-Day Moving Average?Crypto Blog
Read more »
 Bitcoin Price Analysis: BTC Recovers $57K but is the Bottom In Already?Crypto Blog
Read more »
 Bitcoin Price Analysis: BTC Needs to Reclaim This Level to Resume Bull RunCrypto Blog
Read more »
 Bitcoin Price Analysis: BTC Not Quite Ready to Challenge $60K, Watch This Level FirstCrypto Blog
Read more »
 Bitcoin Price Analysis: Likelihood of a BTC Drop to $52K Increasing Following Recent DeclineCrypto Blog
Read more »