
Crypto Blog
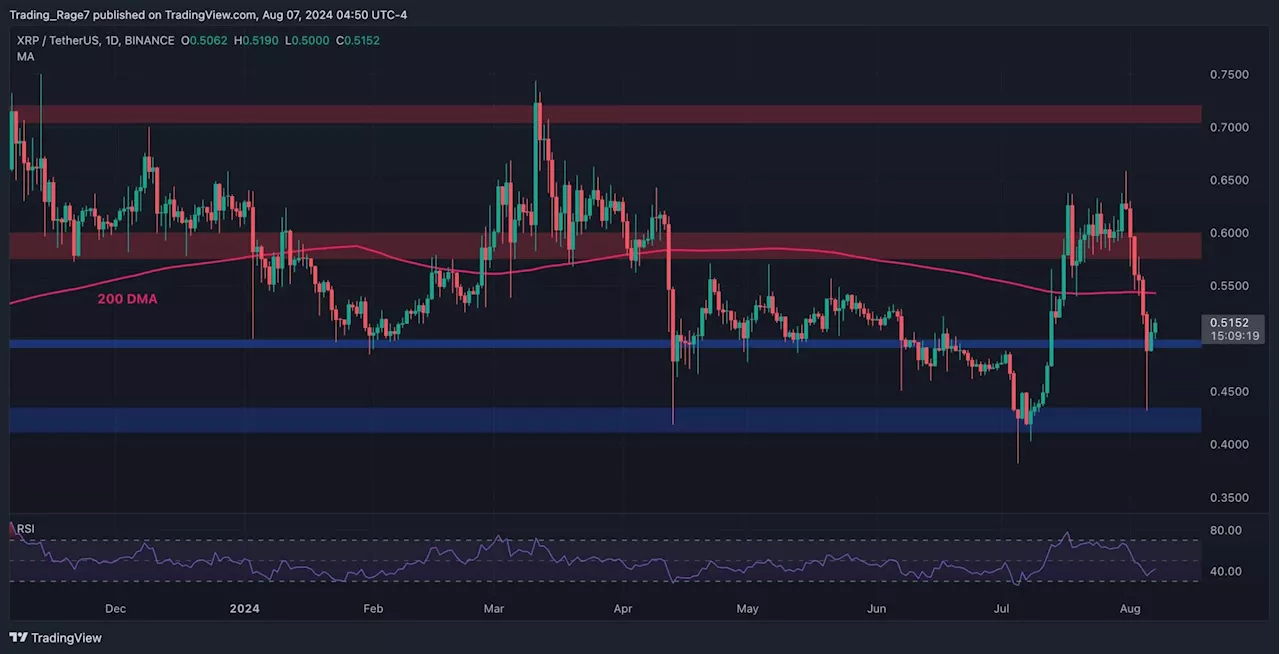
Following a significant drop to the crucial support region of $0.43, Ripple encountered increased buying pressure and saw a substantial surge, pushing the price back above the 100 and 200-day moving averages.
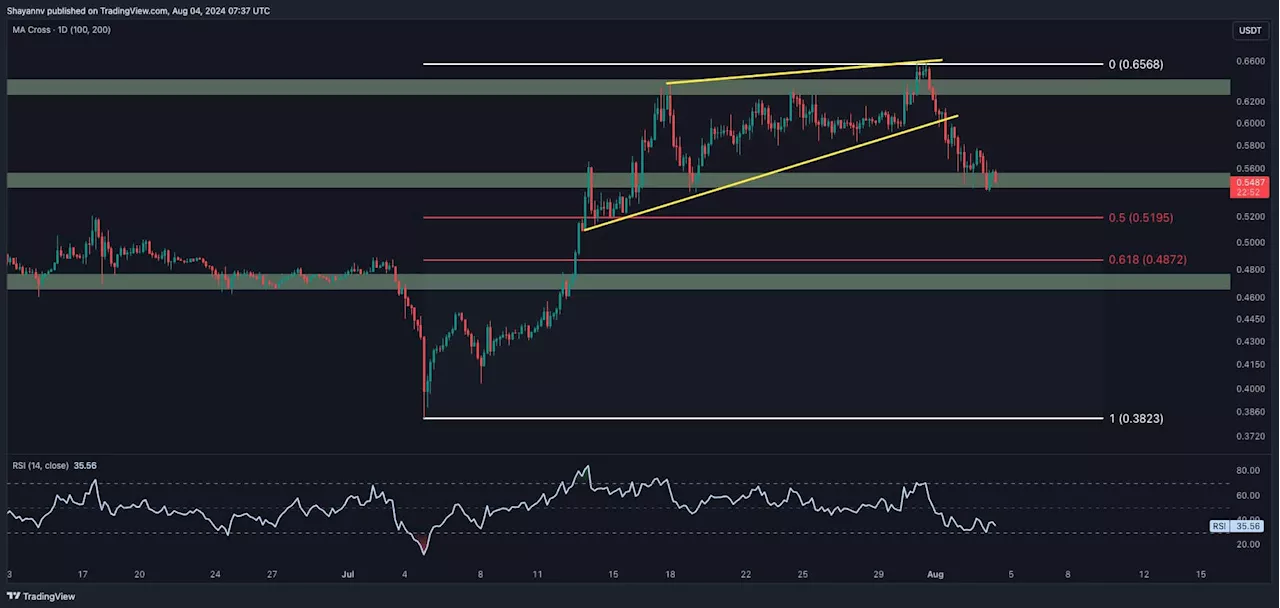
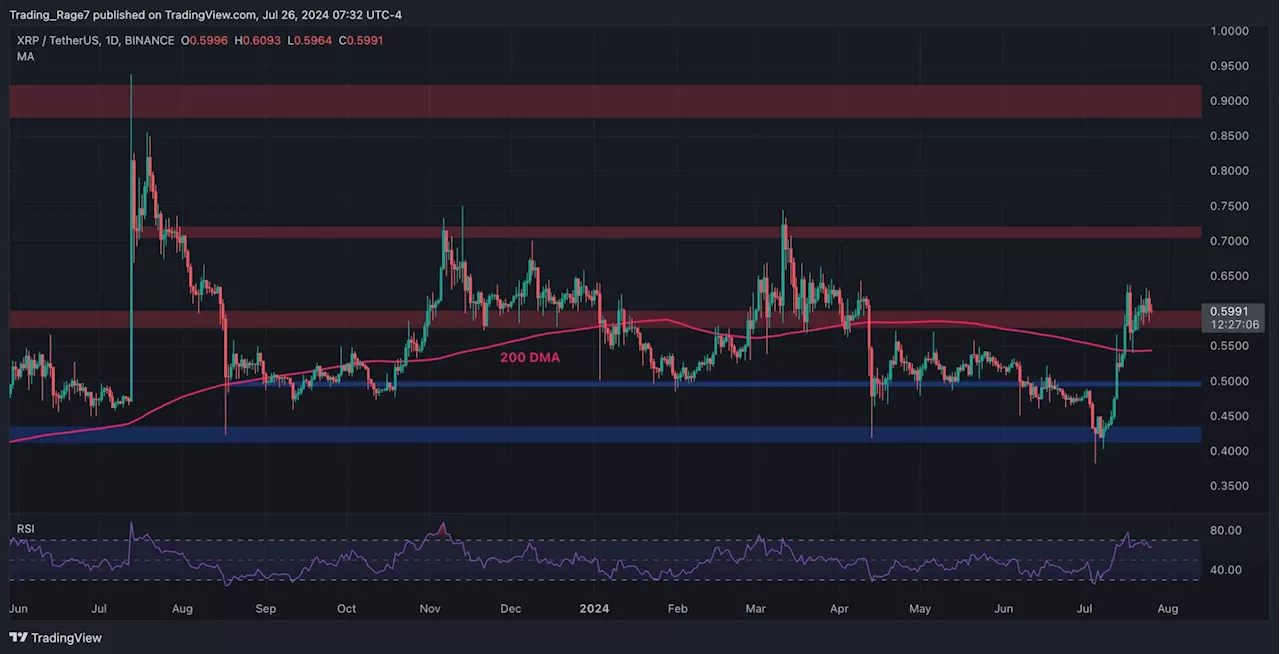
An in-depth look at Ripple’s daily chart shows that after a sharp decline below the 100 and 200-day moving averages, the price hit a significant support region at $0.43, creating a state of fear in the market. Currently, Ripple is confined within a decisive price range, with major support at the 200-day moving average around $0.54 and significant resistance at $0.64. A breakout from this range will likely determine the next move.On the 4-hour chart, Ripple encountered strong selling pressure near the crucial resistance at $0.64, resulting in a sharp decline toward the significant support zone defined by the 0.5 and 0.618 Fibonacci levels.
United Kingdom Latest News, United Kingdom Headlines
Similar News:You can also read news stories similar to this one that we have collected from other news sources.
 Ripple Price Analysis: Here’s Why XRP is Plunging Toward $0.5 and What to Expect NextCrypto Blog
Read more »
 Ripple Price Analysis: XRP Bulls Reclaim $0.5 Following the Devastating 20% CrashCrypto Blog
Read more »
 Ripple Price Analysis: XRP Bulls Keen on Taking Out $0.64 But There’s a CatchCrypto Blog
Read more »
 Ripple Price Analysis: Is XRP Ready to Finally Explode Above $0.60?Crypto Blog
Read more »
 Ripple Price Analysis: Is XRP on the Verge of Exploding to $0.68?Crypto Blog
Read more »
 Ripple Price Analysis: The Reason XRP Crashed by 6% in the Past 24 HoursCrypto Blog
Read more »