
US lifeexpectancy disadvantage is worse than previously believed, according to new study
Life expectancy in the United States is lower than in the rest of the industrialized world, and a new study shows that the nation began falling behind as long ago as the 1950s, decades earlier than previously believed. The findings, published Thursday in the, also show that dozens of countries across six continents have outranked the United States in"The new study challenges two assumptions that have influenced previous research on the U.S.
The study found that increases in U.S. life expectancy began to slow from 1950 to 1954 and slowed even further from 1955 to 1973 . By 1968, the U.S. rank had fallen to 29th. After rebounding temporarily from 1974 to 1982 , U.S. life expectancy slowed again from 1983 to 2009 , essentially"flatlined" from 2010 to 2019 and plummeted in 2020 to 2021 due to the COVID-19 pandemic.
Before 1950, most countries that outperformed the United States were concentrated in Northern and Western Europe. However, in the 1950s and 1960s, several Southern and Eastern European countries also surpassed the United States. A number of Asian countries also began outpacing the United States as early as the 1960s, as well as several Middle Eastern countries beginning in the 1990s and continuing into the 2010s.
"State governments play a large role in promoting the health and well-being of their constituents, and over time we've seen widening disparities in health trends at the state level," Woolf said."This is encouraging, as it shows that states are capable of adopting policies that improve health, but it is also discouraging, because many other states that fared poorly in this study are now actively weakening or rolling back such policies.
United Kingdom Latest News, United Kingdom Headlines
Similar News:You can also read news stories similar to this one that we have collected from other news sources.
 The National Environmental Assessment Reporting System: reporting foodborne illness outbreaks at retail food establishments during 2017–2019The National Environmental Assessment Reporting System: reporting foodborne illness outbreaks at retail food establishments during 2017–2019 CDCgov CDCMMWR foodborne disease infection communicable outbreak publichealth
Read more »
 96% of Americans Have Some COVID-19 ImmunityCDC scientists analyzed data from blood samples of about 143,000 Americans ages 16 and older from July through September 2022 and found that 96% of them contained antibodies to SARS-CoV-2
Read more »
 Most Americans Say Companies Should Publicly Support LGBTQ Community, New GLAAD Survey FindsThe study comes as retailers like Target, Kohl’s and PetSmart have come under attack for their annual LGBTQ Pride merchandise displays and ad campaigns.
Read more »
 Low educational attainment is associated with higher all-cause and cardiovascular mortality in the United States adult population - BMC Public HealthIntroduction Educational attainment is an important social determinant of health (SDOH) for cardiovascular disease (CVD). However, the association between educational attainment and all-cause and CVD mortality has not been longitudinally evaluated on a population-level in the US, especially in individuals with atherosclerotic cardiovascular disease (ASCVD). In this nationally representative study, we assessed the association between educational attainment and the risk of all-cause and cardiovascular (CVD) mortality in the general adult population and in adults with ASCVD in the US. Methods We used data from the 2006–2014 National Death Index-linked National Health Interview Survey for adults ≥ 18 years. We generated age-adjusted mortality rates (AAMR) by levels of educational attainment (| high school (HS), HS/General Education Development (GED), some college, and ≥ College) in the overall population and in adults with ASCVD. Cox proportional hazards models were used to examine the multivariable-adjusted associations between educational attainment and all-cause and CVD mortality. Results The sample comprised 210,853 participants (mean age 46.3), representing ~ 189 million adults annually, of which 8% had ASCVD. Overall, 14.7%, 27%, 20.3%, and 38% of the population had educational attainment | HS, HS/GED, Some College, and ≥ College, respectively. During a median follow-up of 4.5 years, all-cause age-adjusted mortality rates were 400.6 vs. 208.6 and 1446.7 vs. 984.0 for the total and ASCVD populations for | HS vs ≥ College education, respectively. CVD age adjusted mortality rates were 82.1 vs. 38.7 and 456.4 vs 279.5 for the total and ASCVD populations for | HS vs ≥ College education, respectively. In models adjusting for demographics and SDOH, | HS (reference = ≥ College) was associated with 40–50% increased risk of mortality in the total population and 20–40% increased risk of mortality in the ASCVD population, for both all-cause and CVD mortality. Further adjustme
Read more »
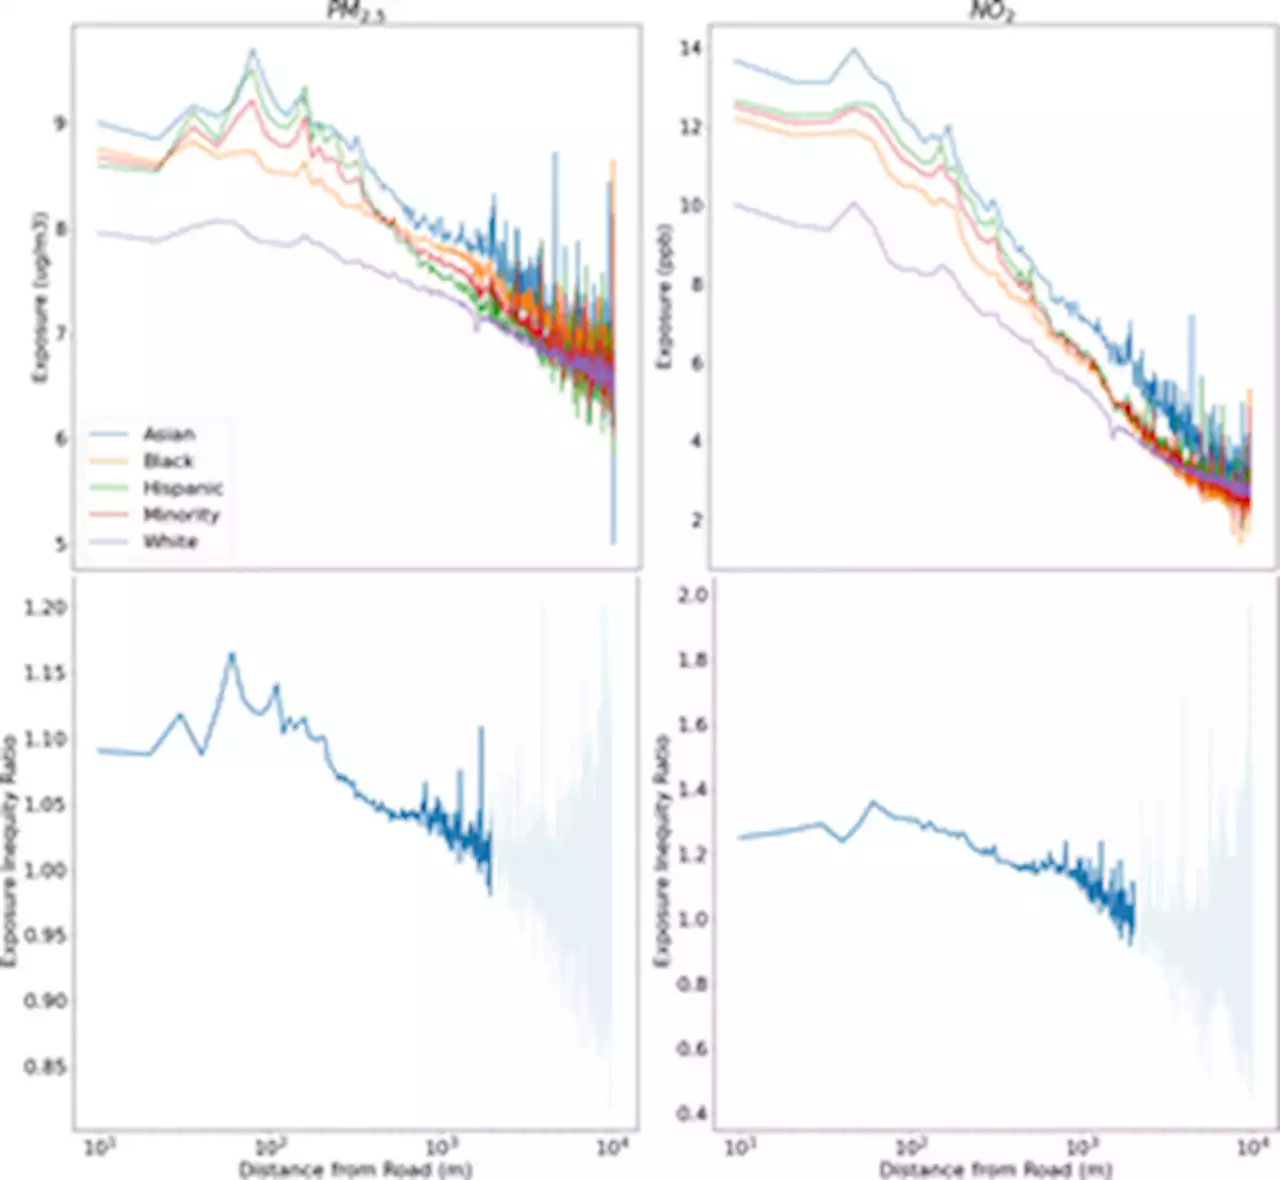 A hyperlocal hybrid data fusion near-road PM2.5 and NO2 annual risk and environmental justice assessment across the United StatesExposure to traffic-related air pollutants (TRAPs) has been associated with numerous adverse health effects. TRAP concentrations are highest meters away from major roads, and disproportionately affect minority (i.e., non-white) populations often considered the most vulnerable to TRAP exposure. To demonstrate an improved assessment of on-road emissions and to quantify exposure inequity in this population, we develop and apply a hybrid data fusion approach that utilizes the combined strength of air quality observations and regional/local scale models to estimate air pollution exposures at census block resolution for the entire U.S. We use the regional photochemical grid model CMAQ (Community Multiscale Air Quality) to predict the spatiotemporal impacts at local/regional scales, and the local scale dispersion model, R-LINE (Research LINE source) to estimate concentrations that capture the sharp TRAP gradients from roads. We further apply the Regionalized Air quality Model Performance (RAMP) Hybrid data fusion technique to consider the model’s nonhomogeneous, nonlinear performance to not only improve exposure estimates, but also achieve significant model performance improvement. With a R2 of 0.51 for PM2.5 and 0.81 for NO2, the RAMP hybrid method improved R2 by ~0.2 for both pollutants (an increase of up to ~70% for PM2.5 and ~31% NO2). Using the RAMP Hybrid method, we estimate 264,516 [95% confidence interval [CI], 223,506–307,577] premature deaths attributable to PM2.5 from all sources, a ~1% overall decrease in CMAQ-estimated premature mortality compared to RAMP Hybrid, despite increases and decreases in some locations. For NO2, RAMP Hybrid estimates 138,550 [69,275–207,826] premature deaths, a ~19% increase (22,576 [11,288 – 33,864]) compared to CMAQ. Finally, using our RAMP hybrid method to estimate exposure inequity across the U.S., we estimate that Minorities within 100 m from major roads are exposed to up to 15% more PM2.5 and up to 35% more NO2 than their White
Read more »